As we head into the first heatwave of the summer, you might be wondering how the high temperatures affect your garden. With tools like the USDA plant hardiness map, we typically only consider low winter temperatures as the primary metric by which we determine which plants to sow. However, we might benefit from incorporating summer temperature trends, like the information presented in the American Horticultural Society’s heat zone map, into our planting decisions. With summer temperatures spiking to record highs due to a changing climate, the impact of high heat on plant life is becoming increasingly relevant to growers.
However, because there is no strict threshold event associated with how plants experience heat, as there is with freezing, the discussion of the impact of high temperature on plant life is a bit more nuanced. Using the heat zone map most effectively requires some background information on how plants respond to high heat. Understanding how plants cope with summertime temperatures and using tools like the heat zone map could help you make more informed decisions about your plantings and how to best mitigate heat damage.

What is the heat zone map
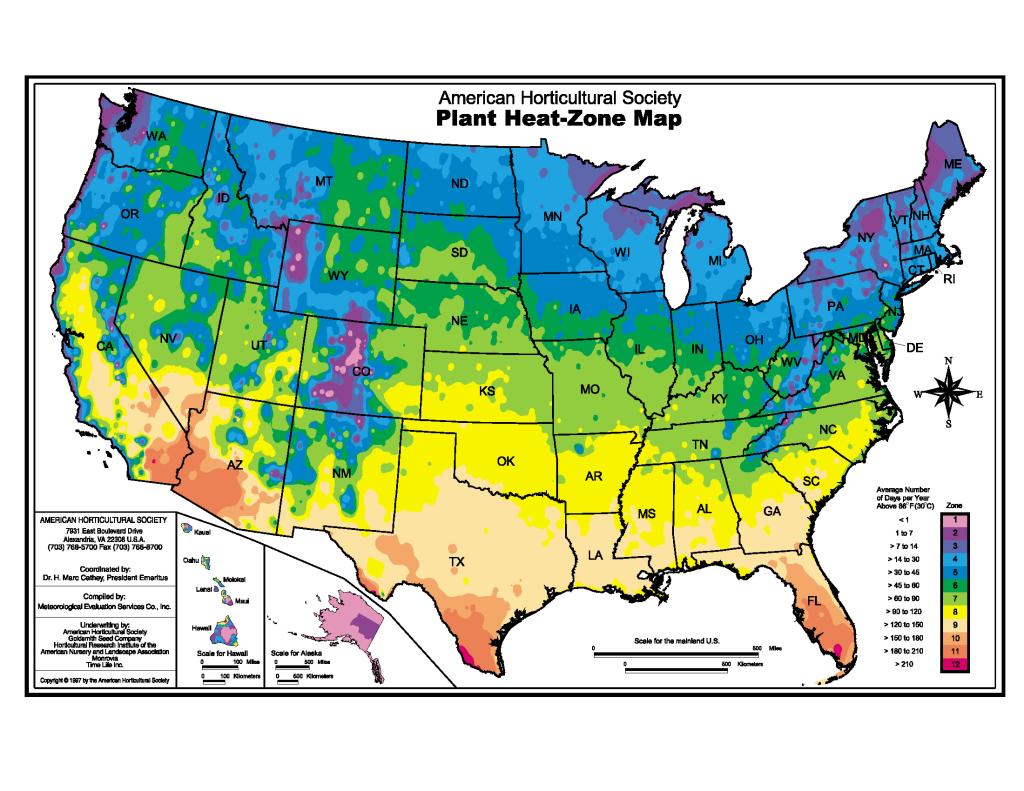
Created by the then president of the American Horticultural Society, H. Marc Cathey, in 1997 the heat zone map was created as a complementary map to the USDA plant hardiness map, which maps the coldest average annual temperature for a given region. Being a relatively newer map, heat zone information isn’t found in all plant or seed catalogs or tagged on all nursery plants and garden varieties. When it does appear it is often featured after the plant hardiness zone information, giving the plant a two-part number code denoting the appropriate cultivation region according to both statistics.
Similar to the plant hardiness map, the heat zone map is made up of 12 zones (the plant hardiness map has 13) based on the average number of “heat days” an area experiences in a year. A “heat day” is defined as a day in which the temperature climbs to over 86℉ (30℃): A zone 1 area has no heat days, whereas a zone 12 area has 210 or more. Daily high temperatures recorded by the National Weather Service between 1974 and 1995 were used to create the map. Since it hasn’t been updated since its release in 1997, it would be interesting to see what shifts, if any, have occurred, especially in light of the zone shifts in the recently updated plant hardiness map.
The impact of high heat on plants and why 86 degrees
However, compared to freezing damage, the impact of high heat is often more variable. High temperatures impact the plant’s biology depending on a myriad of other factors like water content, duration of the heat, and the type of plant experiencing the stress.
We’re all familiar with wilting plants on hot summer days. As the temperature increases water evaporates more quickly from the plant through transpiration. Without a corresponding increase in water access, the plant dehydrates and wilts. Water loss also reduces photosynthetic productivity, severely limiting growth and development. Even worse, plants exposed to high temperatures accumulate toxic reactive oxygen species (ROS) that damage important enzymes and proteins. Many of these effects can be traced back to one of the major deleterious effects of high heat on plants: disruption of cell membranes. While cold stress makes membranes more rigid, high heat disrupts membranes by making them too fluid and prone to leakage.
Most of these effects of heat can be managed by the plant until the temperature reaches around 86 degrees. Most agronomists agree that at this temperature the growth of most plants begins to decrease. However, the duration of high heat is often a more significant factor in the plant’s ability to recover than the high temperature itself.
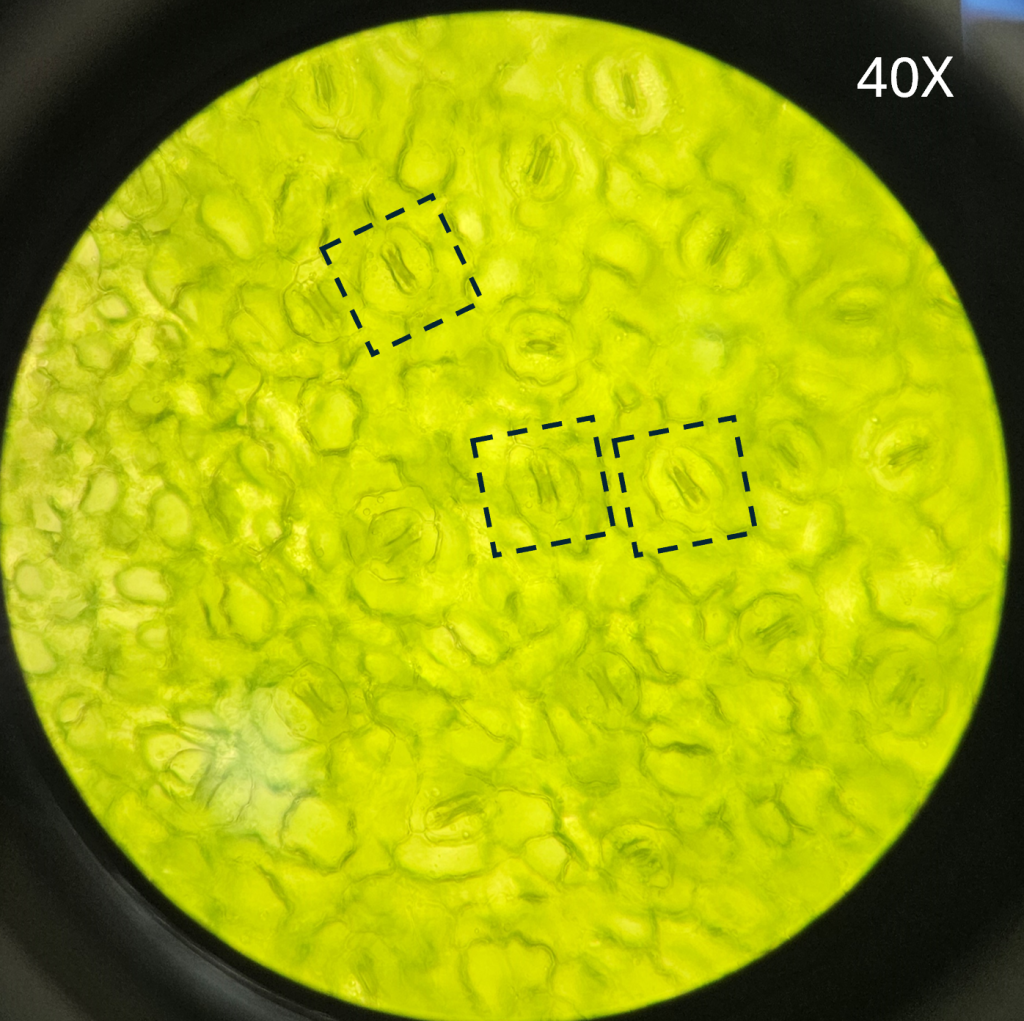
Many of the coping mechanisms plants have developed in response to high temperatures come with trade-offs. For example, plants can mitigate water loss by closing stomata on their leaves, but this also limits the intake of carbon dioxide necessary for photosynthesis.
Plants can also change the angle or morphology of their leaves to limit exposure to the sun and water loss. The leaves of a corn plant will roll into a cylinder, trichome density increases on the leaves of some grasses, and soybean leaves will flip so the lighter bottom surface is facing upward. As expected, this also reduces photosynthetic capacity. While brief periods of high temperature may not have a lasting effect on plant growth and development, several days of limited photosynthetic rate and continued accumulation of ROS could stunt growth, cause early or no flowering, lead to fruit loss, and leaf drop.

How to use the heat zone map in conjunction with the plant hardiness map
To get the most comprehensive information about the appropriate plants to grow in your area, it’s best to consult both maps. The heat zone map is similarly organized to the plant hardiness map using colored-coded zones to denote different temperature ranges. It’s important to note that while the heat zone map is a useful tool, the zones are best thought of as a general guide, not a strict rule. Many plants can survive short bursts of higher temperatures than listed in their zone, especially in well-watered conditions. However, plants that are drought-stressed during a heat wave might not withstand as many heat days as their zone predicts. Therefore, the heat zone map is less of a guide on survivability, and more of a guide describing the ability of a well-watered plant to tolerate a period of heat without a reduction in growth.
How to prevent heat damage in your garden
Water is one of the most important factors in helping your garden cope with high temperatures. Ensuring your plants are sufficiently watered during a heat wave can prevent many of the most damaging effects.
To ensure your garden is getting the most benefit from watering, it’s best to water early in the day before the temperatures rise to give your plants more time to absorb the moisture before evaporation peaks. It’s also best to water the base of the plant, as water droplets on leaves can concentrate light like a magnifying glass and lead to leaf scorching. Mulch can also help maintain moisture and regulate soil temperature. Lastly, using temporary shade cloths could help maintain a balance between water loss and photosynthetic rate.
Summer heat and D.C. plants
With warm temperatures creeping up earlier in the year and more episodes of extreme heat during the summer, thermal tolerance is becoming more of a factor in planting decisions. According to the heat zone map, D.C. experiences an average of 45-60 days of heat days a year (zone 6). However, things like proximity to heat-absorbing asphalt or shade protection can have significant impacts on the temperature a plant experiences. This is especially true in urban areas with their higher proportion of hardscaping with heat sink materials like concrete. Urban heat islands have been shown to increase the ambient air temperature by several degrees, exacerbating heat stress.
Next time you’re at the nursery, make sure to check for heat zone codes after the plant hardiness code. By selecting plants that include zone 6, you can limit the damaging effects of high heat on your plants. And remember to keep yourself–and your plants–hydrated!
Resources:
- https://www.agry.purdue.edu/ext/corn/news/articles.96/p&c9633.htm
- https://crops.extension.iastate.edu/cropnews/2017/07/influence-drought-corn-and-soybean
- https://www.canr.msu.edu/news/understanding_growing_degree_days
- https://ahsgardening.org/ahshistory/#:~:text=The%20map%E2%80%94conceived%20as%20a,ability%20to%20tolerate%20hot%20weather.
- https://www.epa.gov/heatislands#:~:text=Urban%20areas%2C%20where%20these%20structures,2%2D5%C2%B0F%20higher.
Dr. Destiny Davis is the American Association for the Advancement of Science (AAAS) Science and Technology Policy fellow at the U.S. Botanic Garden. She works on all things plant science at the USBG, including writing a 5-year strategic plan for science and conservation, providing technical guidance on current USBG research, and engaging with science and conservation partners on collaborative projects.